

Commercial Property Return Calculator
Enter your property details below to estimate key investment metrics. This tool helps you separate asset performance from financing strategies.
Property & Income Details
Financing Details (Optional)
Investment Metrics
Detailed Breakdown
| Effective Gross Income | $0 |
| Operating Expenses | -$0 |
| Annual Debt Service | $0 |
| Pre-Tax Cash Flow | $0 |
Enter your property details and click "Calculate Returns" to see the analysis.
You’ve spotted a promising office block or retail strip. The agent talks about "high yields," but you’re left wondering: what does that actually mean for your bank account? Calculating the return on commercial property is not just about dividing rent by price. It’s about understanding cash flow, risk, and long-term value growth in a way that separates hobbyists from serious investors.
Most beginners make the mistake of looking at gross yield alone. They see a 7% return and think they’re rich. But if that property has high vacancy rates, massive maintenance costs, or expensive management fees, their actual pocket money might be closer to 3%. To get a true picture, you need to master three specific metrics: Net Operating Income (NOI), Capitalization Rate (Cap Rate), and Cash-on-Cash Return. Here is how to calculate them without getting lost in accounting jargon.
The Foundation: Understanding Net Operating Income (NOI)
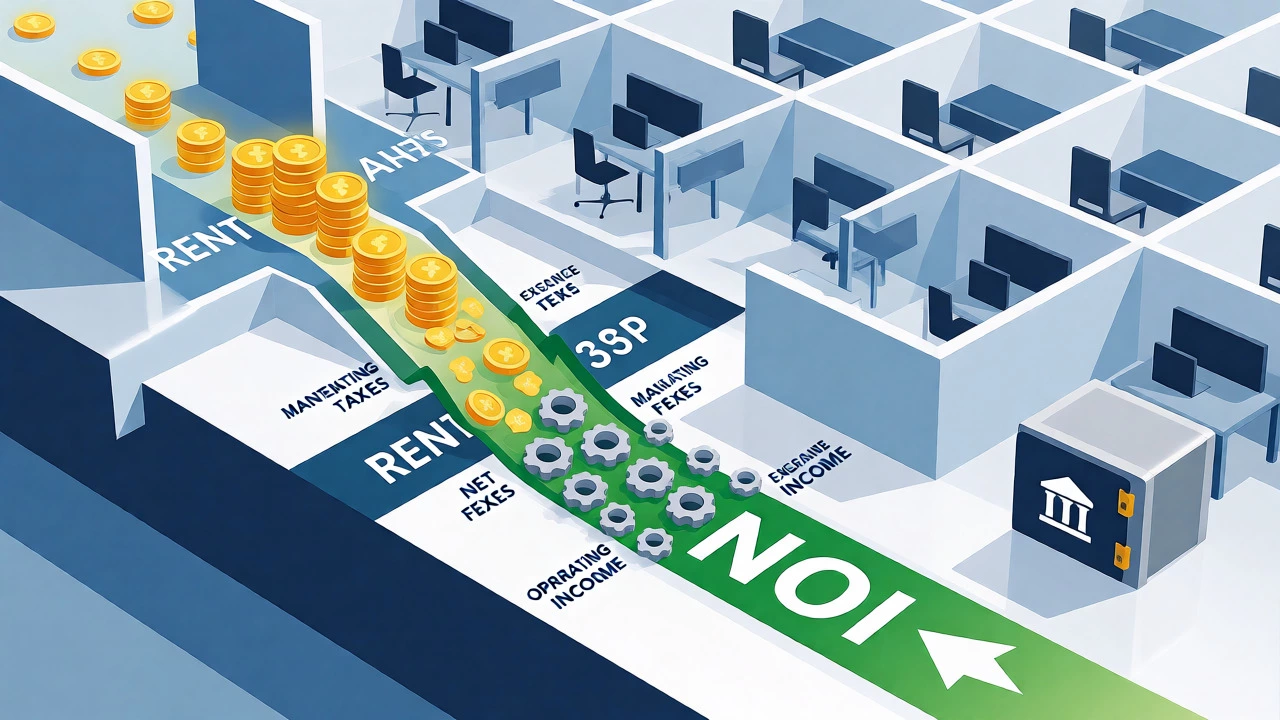
Before you can calculate any meaningful return, you must determine the Net Operating Income. This is the annual income generated by the property after operating expenses are deducted, but before mortgage payments and taxes. Think of it as the property’s pure earning power, independent of how you financed it.
Why exclude mortgage payments? Because different buyers have different loan terms. One investor might pay all cash; another might use 80% debt. If you include interest payments in your initial valuation, you are mixing financing decisions with asset performance. You want to know how well the building performs, not how well your bank deal works.
To calculate NOI, start with Gross Potential Rent. This is what you’d collect if every unit was full and everyone paid on time. Then subtract:
- Vacancy Losses: An estimate of empty space. For commercial real estate, this often ranges from 5% to 10% depending on the market stability.
- Operating Expenses: Property taxes, insurance, utilities (if landlord-paid), repairs, maintenance, and management fees.
Do not include capital expenditures like replacing a roof or installing new HVAC systems in NOI. These are one-off improvements that add value, not recurring operational costs. However, smart investors set aside a reserve fund for these later.
Metric 1: The Cap Rate (Capitalization Rate)
The Cap Rate is the most common benchmark in commercial real estate. It measures the unleveraged return on investment, assuming you bought the property with 100% cash. It allows you to compare properties of different sizes and prices side-by-side.
The formula is simple:
Cap Rate = (Net Operating Income / Purchase Price) x 100
Let’s say you buy a small industrial warehouse for $2 million. After deducting all operating expenses, the NOI is $140,000. Your calculation would be ($140,000 / $2,000,000) x 100 = 7%. This means the property generates a 7% return annually based on its current income stream.
Is 7% good? That depends entirely on the location and risk profile. In Sydney’s CBD, prime office towers might trade at cap rates of 4.5% to 5.5% because they are seen as safe, blue-chip assets. In contrast, a suburban retail center with higher tenant turnover might offer an 8% cap rate to compensate for the added risk. Never judge a cap rate in isolation; always compare it to similar assets in the same sub-market.
Metric 2: Cash-on-Cash Return
While the cap rate ignores debt, most investors use leverage. Cash-on-Cash Return tells you exactly how much cash flow you receive relative to the actual cash you put into the deal. This is the metric that matters most for your personal financial planning.
The formula looks like this:
Cash-on-Cash Return = (Annual Pre-Tax Cash Flow / Total Cash Invested) x 100
Here is where it gets interesting. Let’s stick with our $2 million warehouse example. Assume you put down a 20% deposit ($400,000) plus closing costs ($20,000), totaling $420,000 in cash invested. You take out a $1.6 million loan at 6% interest over 25 years.
Your annual debt service (principal + interest) might be around $120,000. Subtract this from your $140,000 NOI, and you have $20,000 in pre-tax cash flow. Now, divide that $20,000 by your $420,000 investment. Your Cash-on-Cash Return is roughly 4.76%.
Notice the difference? The cap rate said 7%, but your actual cash return is lower because debt service eats up most of the profit. However, you also own an appreciating asset and are building equity through principal repayment. This is why sophisticated investors look at both numbers.
Metric 3: Total Return on Investment (ROI)
Cap rates and cash-on-cash returns ignore one critical factor: capital growth. Over five or ten years, the property value itself may increase significantly. Total ROI accounts for both the cash flow you received and the appreciation in the asset’s value.
To calculate this accurately, you need a multi-year projection. Suppose after five years, you sell the warehouse for $2.4 million (a $400,000 gain). During those five years, you accumulated $100,000 in net cash flow after tax and expenses.
Your total profit is $500,000. Divide this by your initial $420,000 investment. Your Total ROI over five years is approximately 119%. Annualized, this averages out to about 17% per year. This metric helps you understand the wealth-building potential beyond just monthly checks.
| Metric | Formula | Includes Debt? | Best Used For |
|---|---|---|---|
| Cap Rate | NOI / Purchase Price | No | Comparing asset quality across markets |
| Cash-on-Cash | Cash Flow / Cash Invested | Yes | Evaluating immediate liquidity and income |
| Total ROI | (Profit + Appreciation) / Cost | Yes | Long-term wealth accumulation analysis |
Pitfalls That Skew Your Numbers
Calculations are only as good as the data behind them. Many sellers present "pro forma" NOI figures-hypothetical numbers assuming perfect occupancy and zero downtime. Always verify these claims against actual bank statements and lease agreements.
Watch out for hidden costs:
- Lease Commissions: Paying agents to secure new tenants can cost 5-10% of the first year’s rent.
- Tenant Improvements (TIs): If a new tenant requires custom fit-outs, you might pay tens of thousands upfront.
- Management Fees: Typically 3-5% of collected rent. Don’t forget to include this in your expense ratio.
Also, consider the lease structure. In Australia, many commercial leases are "net" or "gross." Under a net lease, tenants pay most operating expenses, boosting your NOI. Under a gross lease, you pay them, reducing your margin. Adjust your calculations accordingly to reflect who bears the cost burden.

Real-World Example: Retail Strip vs. Office Tower
Imagine two properties priced at $1 million each.
Property A: A suburban retail strip with a 6% cap rate. High foot traffic, but short 3-year leases. Tenants change frequently, leading to higher vacancy risks and re-leasing costs.
Property B: A city fringe office tower with a 5% cap rate. Long 10-year leases with government tenants. Low turnover, minimal management hassle, but slower growth potential.
If you prioritize steady, low-effort income, Property B’s lower cap rate might actually offer better risk-adjusted returns due to stability. If you are aggressive and willing to manage vacancies, Property A’s higher yield could translate to superior cash-on-cash returns if you minimize downtime. There is no universal "best" choice; it depends on your risk tolerance and operational capacity.
Final Checklist Before You Buy
Running the numbers is step one. Step two is stress-testing them. Ask yourself:
- What happens if rents drop by 10%?
- Can I still cover debt service if vacancy rises to 15%?
- Does the projected cap rate align with recent sales of comparable properties in the area?
Use conservative estimates. It is better to be pleasantly surprised by actual returns than shocked by lower-than-expected results. Commercial property investing is a marathon, not a sprint. Accurate calculation ensures you run with the right pace.
What is a good cap rate for commercial property?
A "good" cap rate varies by location and asset type. Generally, prime metropolitan assets range from 4% to 6%, while secondary markets or riskier assets like hospitality or self-storage may offer 7% to 10%. Higher cap rates usually indicate higher perceived risk.
Does depreciation affect commercial property returns?
Depreciation is a non-cash tax deduction that reduces taxable income but does not impact cash flow directly. While it doesn't change your NOI or Cap Rate, it improves your after-tax cash position, effectively increasing your Cash-on-Cash return in practical terms.
Should I include renovation costs in my purchase price for ROI calculations?
Yes, for Total ROI calculations, you should include all capital improvements in your total investment cost. However, for Cap Rate calculations, renovations are typically excluded from NOI unless they are part of the stabilized operating budget. Separate the acquisition cost from the improvement cost for clarity.
How do I handle vacant units when calculating NOI?
You should apply a vacancy allowance to your Gross Potential Rent. This is typically estimated as a percentage of total possible rent (e.g., 5-10%) based on historical data for that specific property type and location. Do not assume 100% occupancy unless you have signed leases for every square meter.
Is Cash-on-Cash return more important than Cap Rate?
Neither is universally more important; they serve different purposes. Cap Rate evaluates the asset's intrinsic quality and market value. Cash-on-Cash evaluates the efficiency of your specific financing strategy. Serious investors analyze both to ensure the deal works from both an asset perspective and a personal finance perspective.